What Clarifidata shows depends on which IRS form your nonprofit files
— 990-EZ vs the full 990
Below are two real organizations, side by side. This is not a financial comparison — they're different sizes. It's an honest look at which Clarifidata unlocks, based purely on the IRS form filed. A small nonprofit filing Form 990-EZ discloses less by law than one filing the full Form 990 — so some cards are populated, and others are clearly marked "not available from 990-EZ."
This is a sample of what the full Form 990 unlocks when an organization files complete returns — there's much more across every page. Both orgs: same fiscal year (FY 2024), figures drawn from each filing.
📄 Form 990-EZ German School · FY 2024
📊 Form 990 (full) Drew School · FY 2024
📈 Financial page — 14 of 23 cards on 990-EZ
23 of 23 cards
Total Revenue
$65,039
−2.1% vs PY
Total Expenses
$75,715
+0.9% vs PY
🔒
LUNA
Not on 990-EZliquid cash not isolated
🔒
Liquid Assets
Not on 990-EZno current-asset detail
🔒
Days of Cash
Not on 990-EZneeds liquidity detail
Months of Reserve
10.3 mo
≈ from total net assets
Net Assets ÷ Revenue
1.00×
cushion vs annual revenue
Total Revenue
$20.50M
+7.8% vs PY
Total Expenses
$19.77M
+3.4% vs PY
LUNA
$6.2M
+9.1% vs PY
Liquid Assets
$8.9M
+4.0% vs PY
Days of Cash
~120
+6 days
Months of Reserve
11.9 mo
healthy runway
Net Assets ÷ Revenue
0.96×
strong cushion
🔒
Expense Breakdown
Not available from 990-EZno program / mgmt & general / fundraising split — the signature "where the money goes" view.
Expense Breakdown (FY 2024)

Program 86.5% · $17.1M
Mgmt & general 8.9% · $1.77M
Fundraising 4.5% · $0.90M
🔒
Money Flow · Revenue → Spending
Not on 990-EZno revenue-source or functional-expense breakdown to map
Money Flow · Revenue → Spending
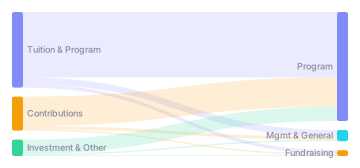
where each dollar comes from, and where it goes
Available, not shown: Revenue&Expenses trend · Operating Cash Flow · Financial Ratios · Balance Sheet Detail · Metrics table (partial)
Not on 990-EZ 🔒: Expense Components Over Time
Available, not shown: Revenue&Expenses trend · Components-over-time · Operating Cash Flow · Financial Ratios · Balance Sheet Detail · Metrics table
🐤 Canaries page — 11 of 24 cards on 990-EZ
24 of 24 cards
Operating Loss Freq

Net Assets Trend

Program Expense Ratio

🔒
Governance & Audit Flags
Not on 990-EZno Part VI section
🔒
Overhead Ratio
Not on 990-EZneeds expense split
🔒
Balance-Sheet Stress
Not on 990-EZno Part X to trend
🔒
Disruption Risk Timeline · 12 yrs
Not available from 990-EZthe early-warning distress model needs balance-sheet & governance detail.
Operating Loss Freq
Net Assets Trend
Program Expense Ratio
Governance & Audit Flags
8 / 9 policies ✓
Overhead Ratio
8.9%
lean overhead
Balance-Sheet Stress
↓ 0.8 pp/yr
leverage easing
Disruption Risk Timeline · 12 yrs

Low risk · 2 watch yrs · 0 high-risk
Available, not shown: Net Income · Net-Assets-to-Revenue · Revenue Concentration (coarse on EZ) · Months of Reserve (partial)
Not on 990-EZ 🔒: Fundraising Efficiency · Board Turnover · all Part VI flags
Available, not shown: ~16 more health flags — Months of Reserve, CEO Tenure, Former Officers, Compliance & Risk…
💰 Compensation page — partial on 990-EZ
8 of 8 cards
🔒
Exec Director Compensation vs Peers
Limited on 990-EZofficer pay is reported, but no Schedule J / peer cohort to benchmark against.
Executive Compensation vs Peer Cohort
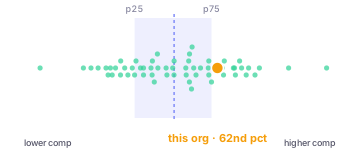
each peer org ▮ p25–p75 ┆ median this org · 62nd pct
Hover any point in-app for the org's name & exact figure — plus Schedule J detail, multi-year comp trends, and role-by-role pay.
🔒
Exec Comp as % of Budget
Limited on 990-EZtotal comp is reported, but no functional budget to benchmark the ratio against peers
Exec Comp as % of Budget · vs Cohort
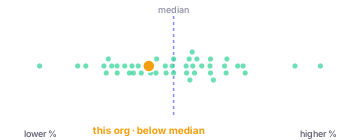
each peer org ┄ cohort median this org · below median
👥 Officers page — available, partial on 990-EZ
4 of 4 cards
Listed officers · sample
| Title | FY | Pay |
| President | 2024 | $0 |
| Treasurer | 2024 | $0 |
| Secretary | 2024 | $0 |
| Director | 2024 | $0 |
48 people · 16 yrs
titles, hours & pay — but no role categories; staff-vs-board split is inferred (unpaid volunteer board).
Officers + staff / board · sample
| Role | FY | Pay |
| Head of School · officer | 2024 | $385k |
| CFO · key employee | 2023 | $212k |
| Dean · highest-paid | 2022 | $156k |
| Board chair · director | 2024 | $0 |
163 people · 24 yrs
role-classified (officer / director / key / highly-comp), hours, org + related-org comp, comp-over-time. Representative sample.
💬 Chat page — available on 990-EZ ✓
available ✓
✓ Available
AI Q&A with citations on every reported figure — fewer underlying sources, but the same grounded, cited answers.
✓ Available
AI Q&A across all facts, schedules & narrative — the richest citation set.
990-EZ — valuable even for small orgs
What every 990-EZ filer gets
- Core financials — full revenue, expense & net-asset history (23 yrs here)
- Health trends — net-income trajectory + operating-loss & net-asset flags
- People — listed officers, titles & pay over time
- AI chat — cited answers on every reported figure
Form 990 (full) — the complete picture
Everything in 990-EZ, plus
- Expense detail — program / M&G / fundraising split + components over time
- Governance — audit & compliance flags (Part VI)
- Liquidity — reserves, days-of-cash & balance-sheet stress
- Benchmarking — peer compensation + role-classified staff/board
See what Clarifidata shows for your nonprofit
Search any of 1.8M US nonprofits — works for 990 and 990-EZ filers alike.